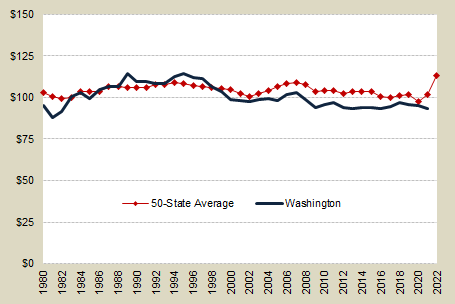
State & local taxes per $1,000 personal income
Washington state & local government taxes per $1,000 personal income
| Fiscal Year | Taxes per $1,000 personal income |
|---|---|
| 2022 | $100.41 |
| 2021 | $93.43 |
| 2020 | $95.05 |
| 2019 | $95.47 |
| 2018 | $97.00 |
| 2017 | $94.26 |
| 2016 | $93.34 |
| 2015 | $93.62 |
| 2014 | $93.80 |
| 2013 | $93.13 |
| 2012 | $93.99 |
| 2011 | $97.01 |
| 2010 | $95.75 |
| 2009 | $94.06 |
| 2008 | $98.73 |
| 2007 | $103.09 |
| 2006 | $101.97 |
| 2005 | $98.39 |
| 2004 | $99.34 |
| 2003 | N/A |
| 2002 | $97.73 |

- Between 1995 and 2022 Washington's rank among the 50 states in state and local taxes per $1,000 of personal income fell from 11th to 32nd.
- In 2000, Washington's state and local taxes per $1,000 of personal income dipped below the average of all the states for the first time since 1985.
- In the 2003-2007 period, the ready availability of consumer credit and a quickly appreciating housing market helped spur consumer spending, resulting in a rebound in taxes relative to personal income.
- A combination of higher-than-average personal income growth, a state spending limit holding down expenditures, and tax cuts through the legislative and initiative processes, pushed taxes down beginning in 1995.
- State comparisons of state & local taxes relative to personal income are available from the Washington Department of Revenue's Comparative State and Local Taxes.
Data sources:
- U.S. Census Bureau: State and Local Government Finances
- U.S. Bureau of Economic Analysis (personal income)
E-mail: OFM.Forecasting@ofm.wa.gov
Last updated
Friday, January 3, 2025


