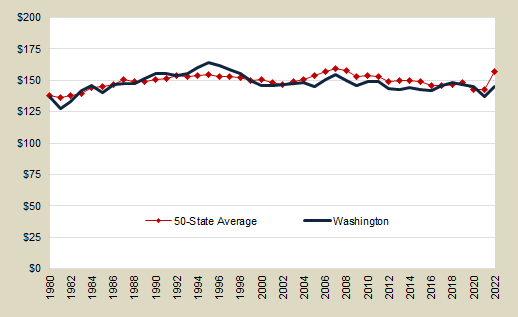
State & local government revenues per $1,000 personal income
Washington state & local government revenues per 1,000 personal income
| Fiscal Year | Revenues per $1,000 personal income |
|---|---|
| 2022 | $145.34 |
| 2021 | $136.87 |
| 2020 | $145.25 |
| 2019 | $146.57 |
| 2018 | $148.29 |
| 2017 | $145.53 |
| 2016 | $142.08 |
| 2015 | $142.91 |
| 2014 | $144.11 |
| 2013 | $142.68 |
| 2012 | $143.47 |
| 2011 | $148.90 |
| 2010 | $148.68 |
| 2009 | $145.45 |
| 2008 | $149.77 |
| 2007 | $154.45 |
| 2006 | $150.86 |
| 2005 | $145.33 |
| 2004 | $148.46 |
| 2003 | N/A |
| 2002 | $146.77 |
Revenues per $1,000 personal income

- Revenues include fees, charges for services, and interest earnings as well as taxes. See State & Local Government Revenue Sources for a breakdown of revenues into individual sources.
- In fiscal year 2022, Washington ranked 30th among the 50 states in state and local government revenues per $1,000 of personal income.
- Revenue Definition – All amounts of money received by a government from external sources--net of refunds and other correcting transactions--other than from issuance of debt, liquidation of investments, and as agency and private trust transactions. Note that revenue excludes noncash transactions such as receipt of services, commodities, or other "receipts in kind."
Data sources:
- U.S. Census Bureau: State and Local Government Finances
- U.S. Bureau of Economic Analysis (personal income)
E-mail: OFM.Forecasting@ofm.wa.gov
Last updated
Friday, January 3, 2025


