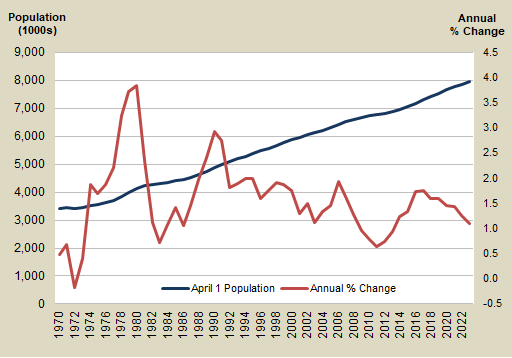
Total population and percent change
| Year | April 1 Population | Annual Percent Change |
|---|---|---|
| 2024 | 8,035,700 | 1.05 |
| 2023 | 7,951,150 | 1.10 |
| 2022 | 7,864,400 | 1.26 |
| 2021 | 7,766,925 | 1.45 |
| 2020 | 7,656,200 | 1.45 |
| 2019 | 7,546,400 | 1.60 |
| 2018 | 7,427,570 | 1.60 |
| 2017 | 7,310,300 | 1.76 |
| 2016 | 7,183,700 | 1.73 |
| 2015 | 7,061,410 | 1.34 |
| 2014 | 6,968,170 | 1.25 |
| 2013 | 6,882,400 | 0.95 |
| 2012 | 6,817,770 | 0.74 |
| 2011 | 6,767,900 | 0.64 |
| 2010 | 6,724,540 | 0.79 |
| 2009 | 6,672,159 | 0.97 |
| 2008 | 6,608,245 | 1.27 |
| 2007 | 6,525,086 | 1.63 |
| 2006 | 6,420,258 | 1.93 |
| 2005 | 6,298,816 | 1.45 |
| 2004 | 6,208,515 | 1.33 |
1990-2024

- The April 1, 2024, population estimate places Washington’s population at 8,035,700. This represents an increase of 84,550, or 1.05%, since last year.
- Washington's annual rate of population growth had been below 1.0% from 2009 to 2013 due to the sluggish economy. Economic activity has a strong influence on net migration.
- Washington's population has experienced wide swings in growth. One of the low-points of the post-war era came in 1972, in the aftermath of the Boeing-bust. Washington experienced a decline in population as ranks of unemployed aerospace workers and others sought gainful employment outside Washington state.
- A rebounding aircraft sector, and solid economic growth overall, resulted in record growth in 1980 when population expanded by 3.85%, a pace unmatched since.
Data source:
E-mail: OFM.Forecasting@ofm.wa.gov
Last updated
Friday, January 3, 2025


