Distribution of Washington population by age and gender
Washington state population by age group
Census 2020
| Age Group | Population |
|---|---|
| 0-4 | 437,142 |
| 5-9 | 473,005 |
| 10-14 | 488,337 |
| 15-19 | 475,428 |
| 20-24 | 494,135 |
| 25-29 | 555,317 |
| 30-34 | 579,568 |
| 35-39 | 561,695 |
| 40-44 | 495,462 |
| 45-49 | 463,942 |
| 50-54 | 464,438 |
| 55-59 | 486,948 |
| 60-64 | 478,618 |
| 65-69 | 425,453 |
| 70-74 | 340,300 |
| 75-79 | 221,272 |
| 80-84 | 134,275 |
| 85+ | 130,975 |
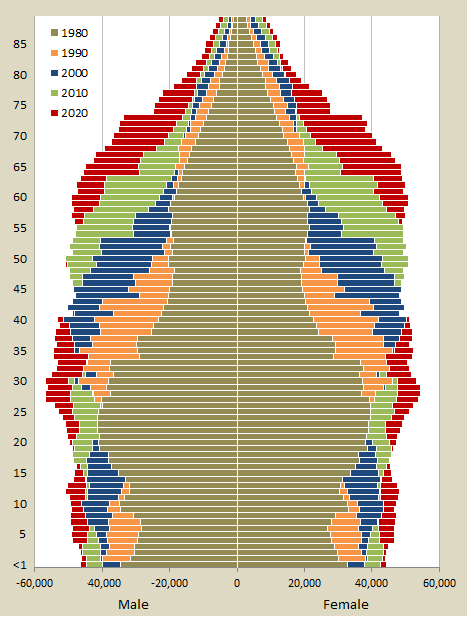
- Population pyramids show the population distribution by age in bar-chart fashion with females on the right and males on the left. Births, deaths, and migration shape the pyramid.
- The bulge centered on the age range of 20 to 30 years in the 1980 pyramid corresponds to the post-World War II Baby Boomers, who were young adults at the early labor force age. This early labor force population was at an all-time high.
- The Baby Boom bulge can be seen maturing in the subsequent profiles. Washington's median age increased from 29.8 years in 1980 to 37.3 years in 2010, and 38.7 years in 2023.
- The constriction of the pyramid in the ages younger than the Baby Boom shows smaller population in these ages due to the "Baby Bust" - the marked reduction in births following the boom from the mid-1960s through the mid-1970s.
- Most evident at the tip of the population pyramid is the larger number of females in the older age cohorts. Males constitute the majority in each age cohort until the late 40's after which females outnumber males.
Data source:
E-mail: OFM.Forecasting@ofm.wa.gov
Last updated
Friday, January 3, 2025


