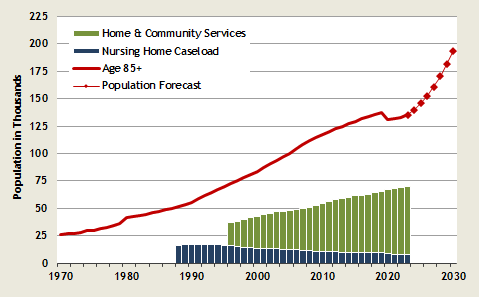
State-supported nursing home caseload
State-Supported Nursing Home and Home & Community Services Caseloads
(average monthly)
| Fiscal Year |
Nursing Home Caseload |
Home & Community Services |
|---|---|---|
| 2024 | 7,736 | 66,798 |
| 2023 | 7,616 | 62,657 |
| 2022 | 7,629 | 61,130 |
| 2021 | 7,969 | 60,571 |
| 2020 | 9,214 | 58,463 |
| 2019 | 9,635 | 56,240 |
| 2018 | 9,706 | 54,440 |
| 2017 | 9,775 | 52,619 |
| 2016 | 9,915 | 52,846 |
| 2015 | 10,032 | 51,577 |
| 2014 | 10,150 | 50,065 |
| 2013 | 10,231 | 49,034 |
| 2012 | 10,324 | 48,139 |
| 2011 | 10,596 | 46,038 |
| 2010 | 10,866 | 44,080 |
| 2009 | 10,993 | 41,779 |
| 2008 | 11,288 | 39,506 |
| 2007 | 11,767 | 38,094 |
| 2006 | 12,153 | 37,041 |
| 2005 | 12,310 | 35,481 |
| 2004 | 12,671 | 34,635 |
Compared to Elderly Population

- State-supported nursing home beds are limited by policy.
- State-supported nursing home beds have not kept pace with the growth of the population aged 85 and above. However, increasingly the elderly population is being served by in-home, assisted care facilities, and community-based programs.
- The population of those 85 and above will grow very quickly as the Baby Boom cohort ages.
- The sharp decline in 85+ population in 2020 was likely caused by COVID-19 related deaths.
- From fiscal year 2020 to fiscal year 2023, the state-supported nursing home caseload has declined by 22%. In fiscal year 2024, state-supported nursing home caseload increased slighltly 1.5% year-over-year.
Data sources:
E-mail: OFM.Forecasting@ofm.wa.gov
Last updated
Thursday, December 12, 2024


