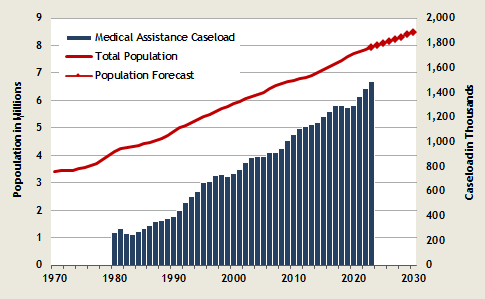
Medical assistance caseload
| Fiscal Year | Average Monthly Caseload |
|---|---|
| 2024 | 1,399,413 |
| 2023 | 1,488,429 |
| 2022 | 1,427,678 |
| 2021 | 1,361,556 |
| 2020 | 1,288,075 |
| 2019 | 1,276,737 |
| 2018 | 1,288,885 |
| 2017 | 1,289,802 |
| 2016 | 1,243,903 |
| 2015 | 1,203,654 |
| 2014 | 1,156,549 |
| 2013 | 1,136,194 |
| 2012 | 1,125,384 |
| 2011 | 1,107,763 |
| 2010 | 1,052,649 |
| 2009 | 1,004,894 |
| 2008 | 940,683 |
| 2007 | 914,900 |
| 2006 | 913,070 |
| 2005 | 880,788 |
| 2004 | 875,363 |
Compared to Total Population

There have been several significant policy changes that have impacted the Medical Assistance caseload:
- July 2007 - Cover All Kids expands health care coverage eligibility.
- July 1988: First Steps expansion for children and pregnant women.
- July 1994: Expansion to 200% federal poverty level (FPL) for children.
- The Affordable Care Act made it possible for the potential enrollment of over 300,000 newly eligible low-income individuals to the medical assistance caseload. That has since expanded to over 686,000 potential individuals in fiscal year 2024. Their budgetary impact is moderated because federal matching funds currently pick up 90% of the cost. More will be added to this tally in the future as the federal matching rates decline.
- For the first time since 2020, the medical assistance caseload has decreased, showing a year-over-year decline of 5.98%.
Data sources:
E-mail: OFM.Forecasting@ofm.wa.gov
Last updated
Thursday, December 12, 2024


