Other pages about the topic: Economy
Formed in October of 2020, the Washington Resilience Group (originally called the Washington Recovery Group) plays a key role in setting priorities that strengthen the resiliency of our state and all Washingtonians as we emerge from the COVID-19 pandemic.
Released September 2012 (Revised October 2015)
In 2010, seven state agencies and the legislative staff, under the direction of Dr. William Beyers, University of Washington Geography Professor, and Marc Baldwin, Office of Financial Management (OFM), initiated the estimation of a new version of the Washington State Input-Output (I-O) model. OFM staff member Dr. Ta-Win Lin served as the project coordinator.
Updated April 2011
In 2006, seven state agencies and the legislative staff, under the direction of University of Washington Geography Professor, Dr. William Beyers, and the Office of Financial Management (OFM) Assistant Director of Forecasting Division, Dr. Irv Lefberg, initiated the estimation of a new version of the Washington State Input-Output model. OFM staff Dr. Ta-Win Lin served as the project coordinator.
Value of Washington exports
2022 ($ Millions)
Manufacturing employment as a percent of total, 1980
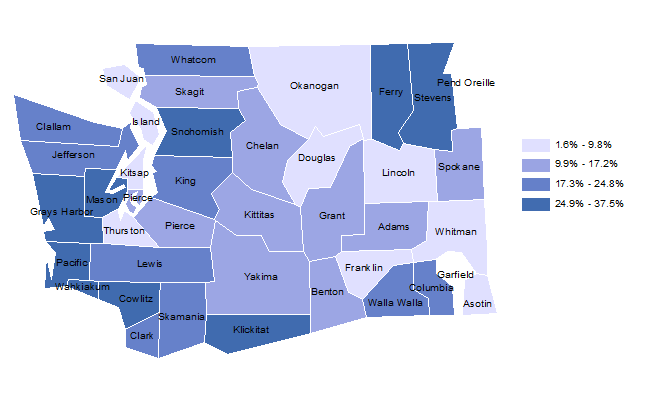
- State average: 17.8%
- Highest county: Wahkiakum at 37.5%
- Lowest county: Whitman at 1.6%
return to top
Per Capita Personal Income, 1980
Inflation-Adjusted to 2022 Dollars

Average Wages, 1980
Inflation-Adjusted to 2022 Dollars

Average wages
Inflation-adjusted to 2022 dollars
Pages
